
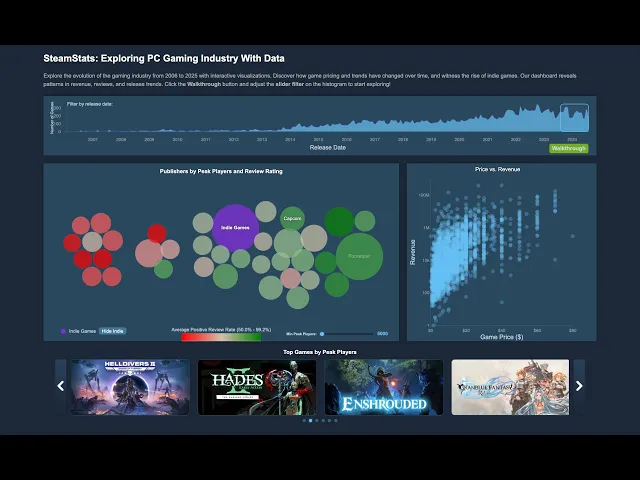
SteamStats turns a large Steam games dataset into a narrative, visual experience tailored for curious gamers, data enthusiasts, and industry observers. Built with D3.js, the dashboard coordinates multiple views—a high-level release timeline, a detailed temporal zoom, publisher and game-level bubble charts, a price–review scatter plot, and a responsive game list—to let users pivot seamlessly between macro trends and individual titles. With interactive filters, tooltips, and a guided walkthrough, visitors can uncover patterns such as the rise of indie publishers, shifts in pricing strategies, and how reviews correlate with popularity. Rather than presenting static graphs, SteamStats invites exploration: every hover, click, and filter refines the story of how PC gaming on Steam has changed over nearly two decades.
